A Mean Reversion Strategy Using IBS That Hits 75% Win Rate on SPY

I stumbled upon a mean reversion strategy that shows some potential. I'll get straight into it.
Entry Condition
close < (10 day high - 2.5 * (25 day avg high - 25 day avg low))
and
IBS < 0.3
What This Means
Today's close should be less than the highest high of the last 10 bars minus 2.5 times the last 25 days average stock movement.
Additionally, IBS should be below 0.3.
What's IBS? Not irritable bowel syndrome.
IBS (Internal Bar Strength) = (close - low) / (high - low)
This gives a 0–1 range. 0 means close = low (weakness), 1 means close = high (strength). Below 0.3 = the stock closed in the bottom 30% of the day's range.
Exit Condition
close > yesterday's high
Yep, very simple.
Backtest: SPY (2006–2026)
Testing parameters:
- Timeframe: Daily
- Ticker: SPY
- Slippage: $0.01 per share
- Commission: $0.01 per share
- Duration: March 2006 – March 2026
- Capital: $100,000
Core Returns
| Metric | Value |
|---|---|
| Total Return | 334.84% |
| CAGR (annualized return) | 7.75% |
| Profit Factor | 2.02 |
| Win Rate | 75.00% (180W / 60L) |
Risk Metrics
| Metric | Value |
|---|---|
| Max Drawdown | 15.26% |
| Calmar Ratio (return ÷ drawdown) | 0.51 |
| Sharpe Ratio (return per unit of risk) | 0.46 |
| Sortino Ratio (return per unit of downside risk) | 0.81 |
| Avg Profit | $3,677.39 |
| Avg Loss | -$5,451.58 |
Position and Efficiency
| Metric | Value |
|---|---|
| Time in Market | 21.02% |
| Avg Hold Time | 5.4 days |
| Longest Trade | 29.0 days |
| Shortest Trade | 1.0 day |
Execution and Friction
| Metric | Value |
|---|---|
| Total Trades | 240 |
| Total Costs (Fees/Slippage) | $11,870.20 |
| Initial Capital | $100,000 |
| Final Capital | $434,835.64 |

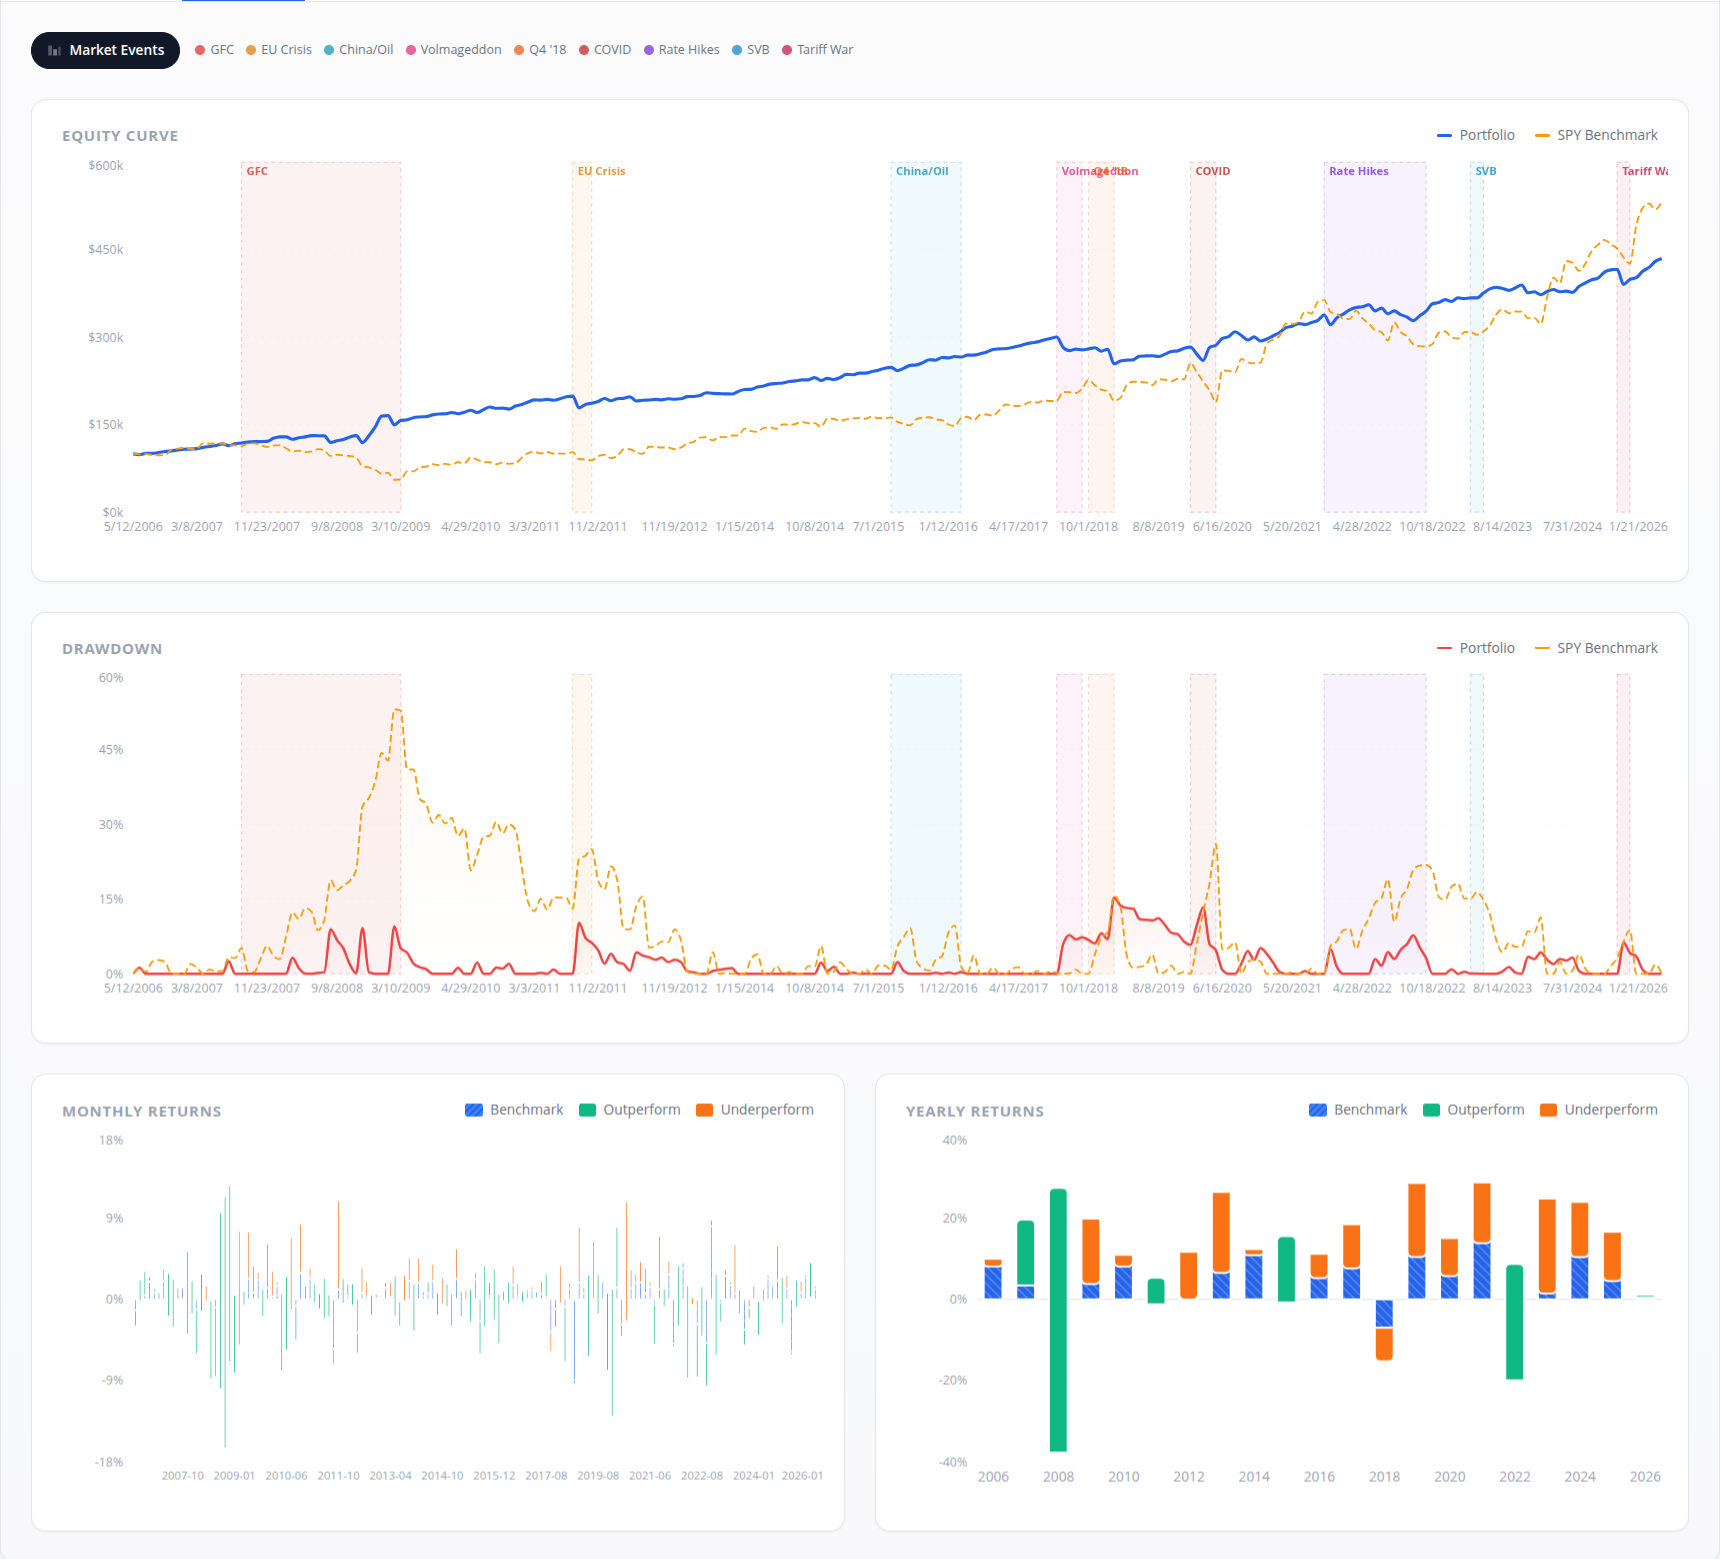
75% win rate with only 15% max drawdown is solid. The 7.75% CAGR isn't spectacular, but you're only in the market 21% of the time. The remaining 79% of time could run a different strategy or the same strategy on other instruments.
How It Performs Across Other Instruments
I ran the same strategy on QQQ, AAPL, and ABNB. Here's how the key numbers compare:
| Metric | SPY (2006–2026) | QQQ (2011–2026) | AAPL (2006–2026) | ABNB (2020–2026) |
|---|---|---|---|---|
| Total Return | 334.84% | 265.74% | 809.61% | 26.35% |
| CAGR | 7.75% | 9.18% | 11.77% | 4.74% |
| Win Rate | 75.00% | 70.74% | 70.27% | 56.52% |
| Profit Factor | 2.02 | 2.15 | 2.07 | 1.16 |
| Max Drawdown | 15.26% | 11.92% | 29.56% | 28.53% |
| Calmar Ratio | 0.51 | 0.77 | 0.40 | 0.17 |
| Sharpe Ratio | 0.46 | 0.42 | 0.67 | 0.00 |
| Sortino Ratio | 0.81 | 0.79 | 1.07 | 0.00 |
| Time in Market | 21.02% | 16.41% | 25.18% | 7.28% |
| Total Trades | 240 | 188 | 259 | 69 |
| Avg Hold Time | 5.4 days | 5.4 days | 6.1 days | 6.7 days |
| Final Capital | $434,835 | $365,740 | $909,613 | $126,349 |
QQQ

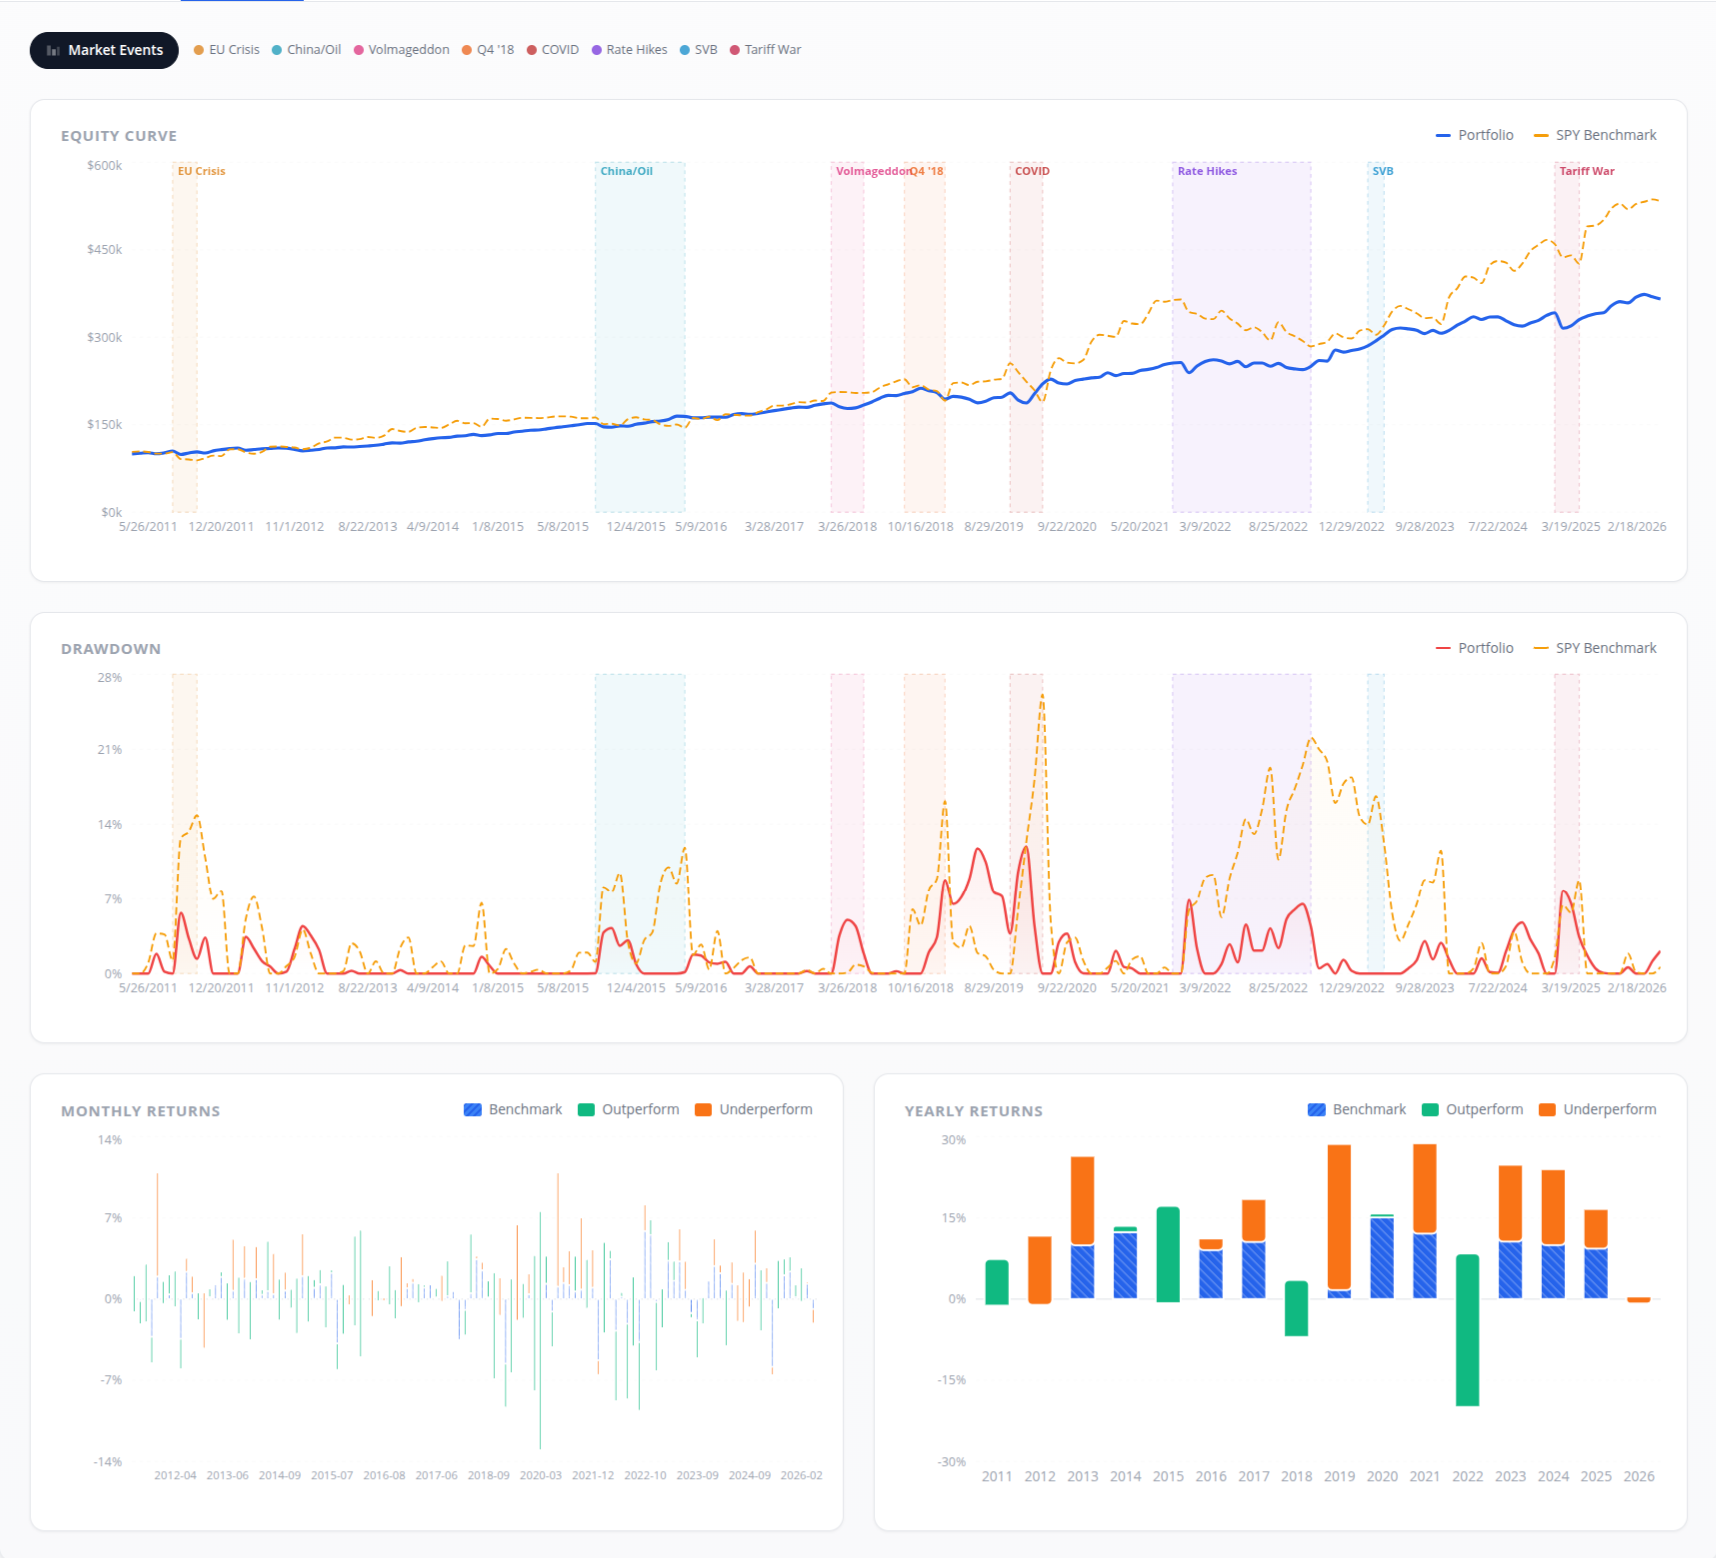
The ~70% win rate holds just like it did with SPY, and a CAGR of ~9% is not bad at all. But here too the time invested is very low — only 16% of the time the capital was utilized.
AAPL

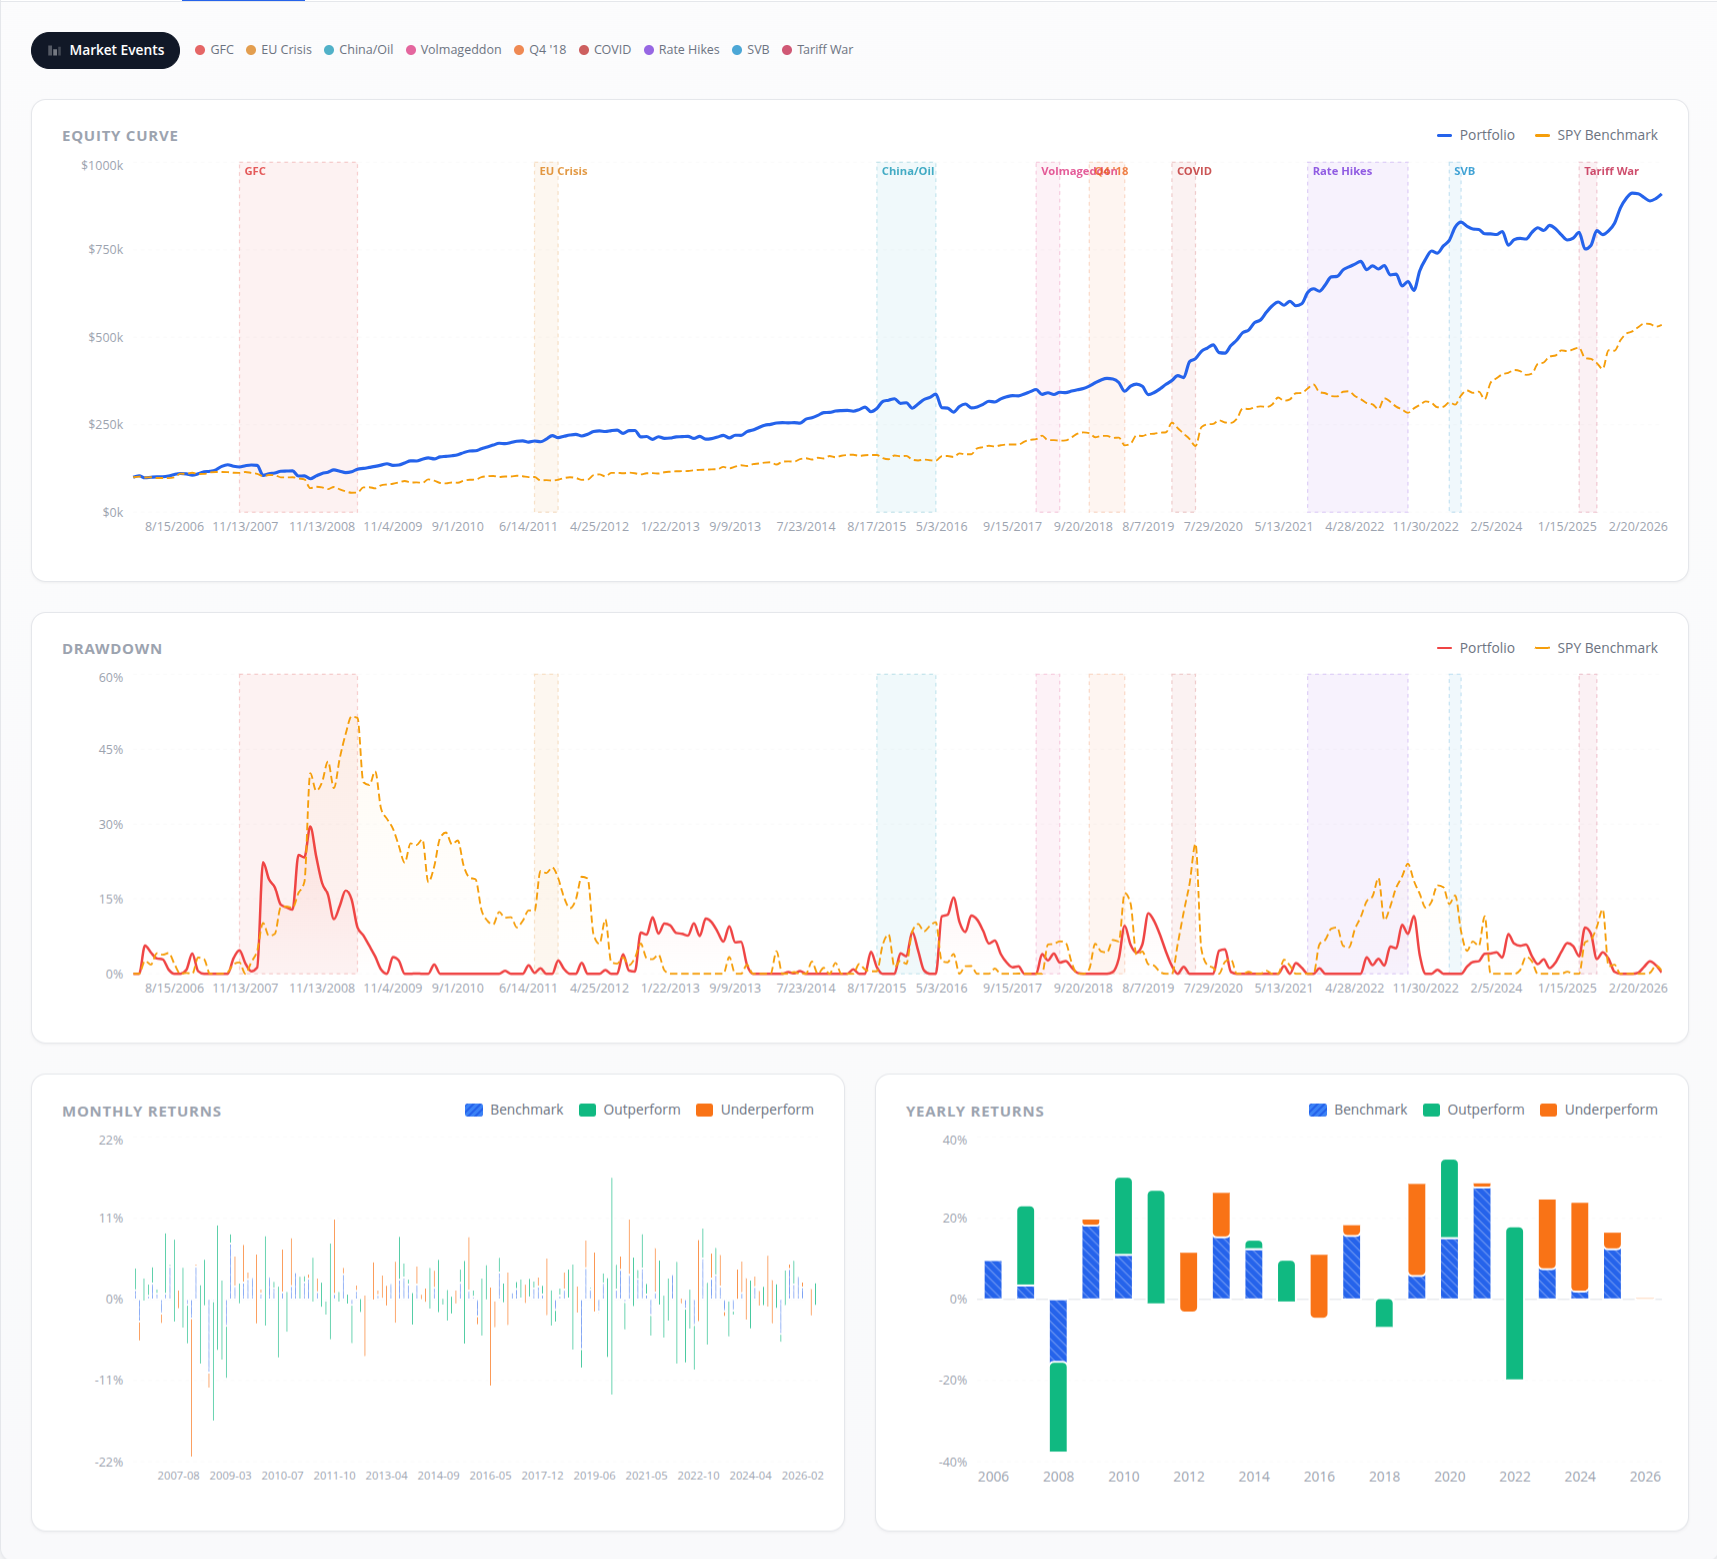
Interestingly, the ~70% win rate holds here too, with only 25% time invested. The 11.77% CAGR looks great, but note the 29.56% max drawdown — that's nearly double what we saw with SPY.
ABNB

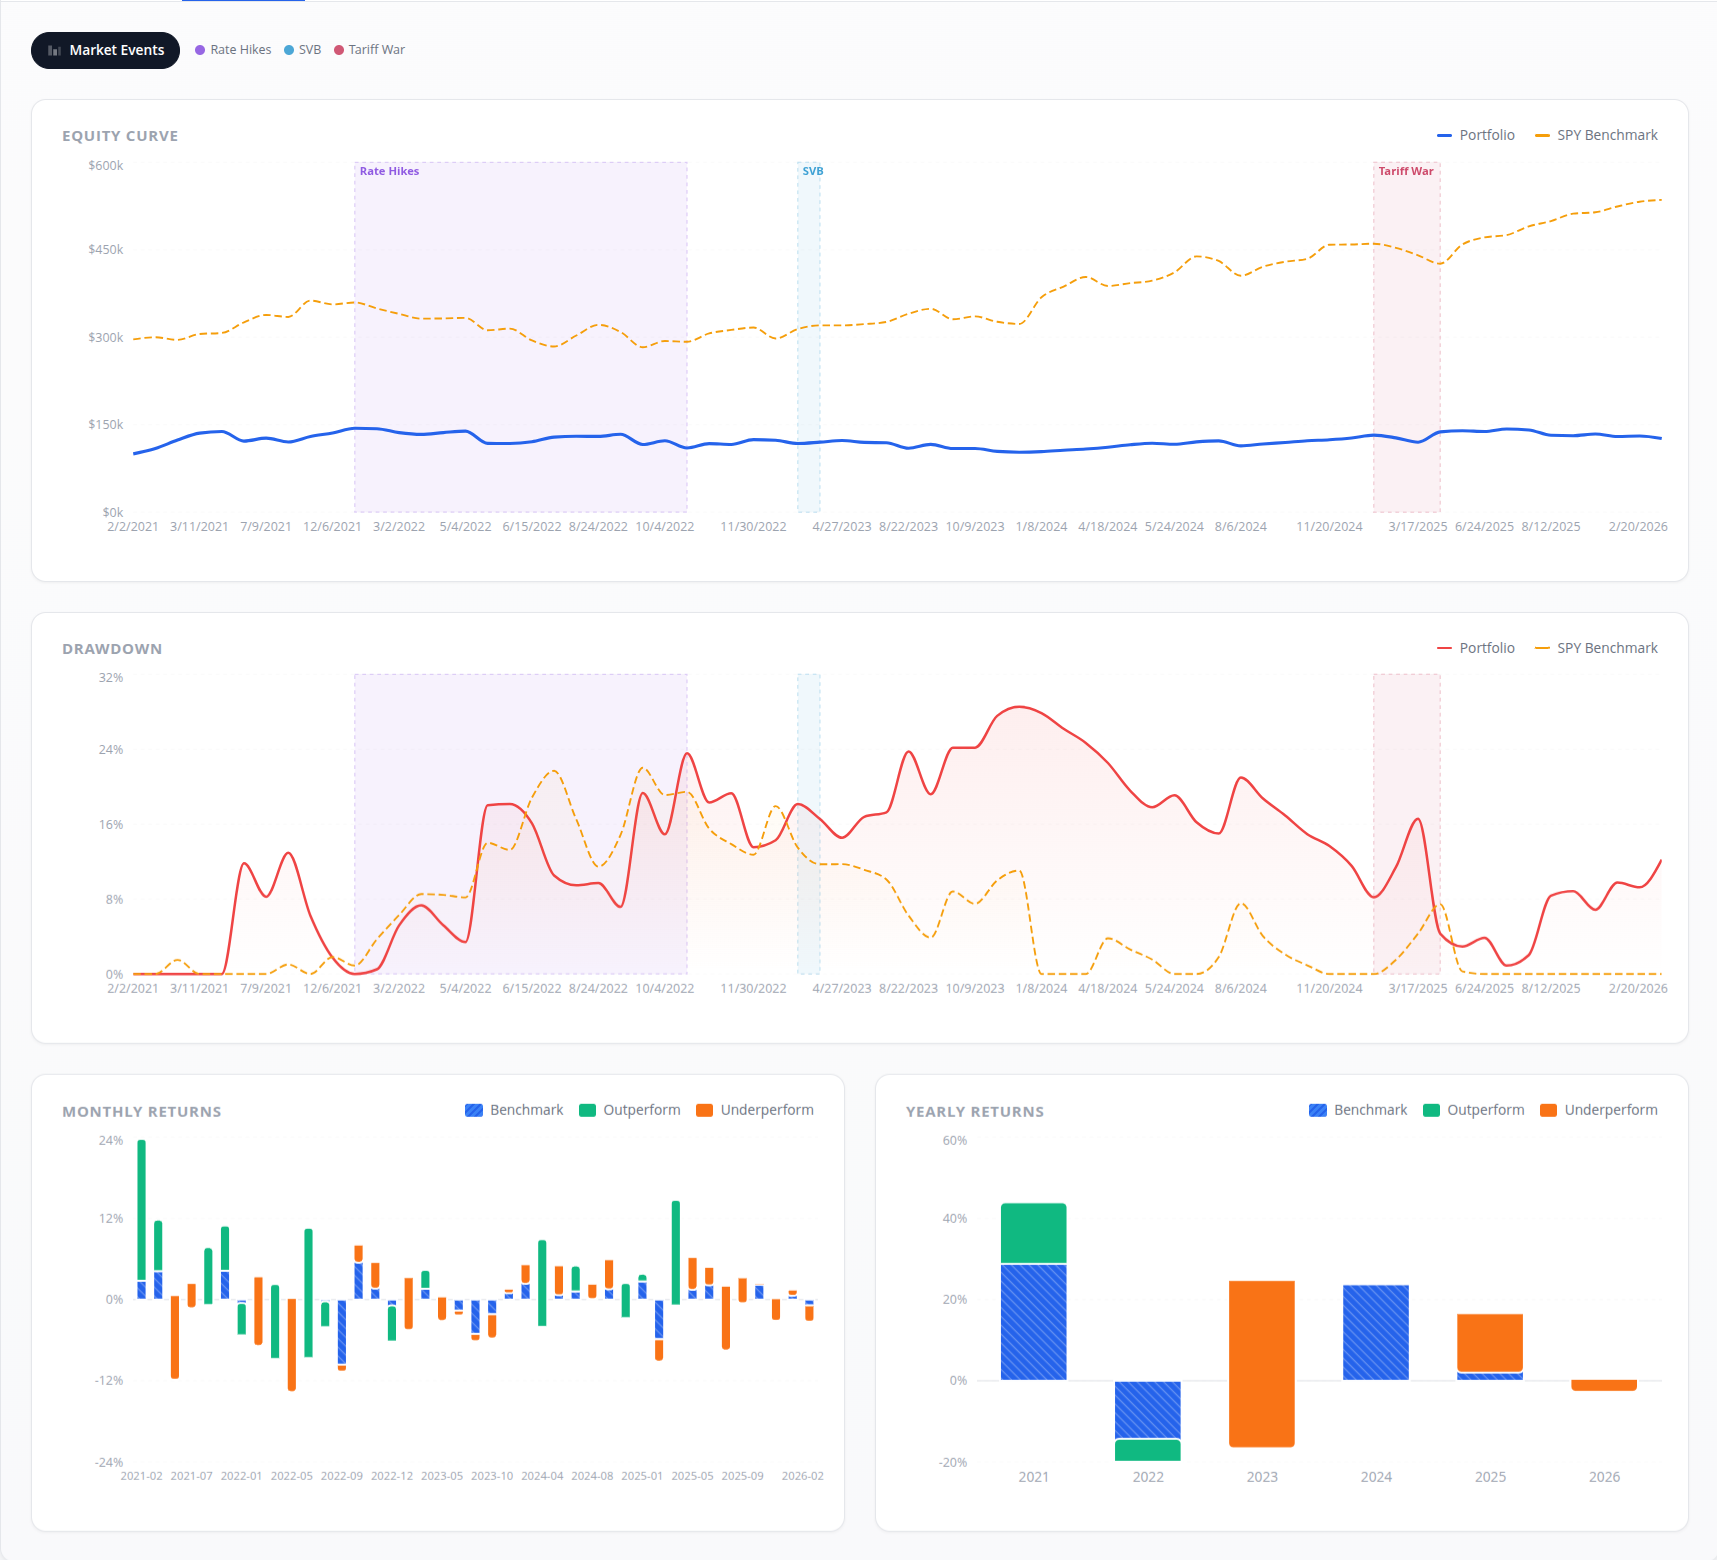
Win rate dropped to 56%, which is weak for mean reversion. But ABNB only IPO'd in late 2020 and has been in a downtrend since — just 69 trades and 7% time invested. Hard to draw conclusions from such limited data. The fact that it's still slightly profitable on a falling stock is something, I guess.
Takeaways
- ~70% win rate held across SPY, QQQ, and AAPL
- Profit factor consistently around 2.0 on ETFs
- Time invested stays low (16–25%) — capital efficient
- Individual stocks = higher returns but higher drawdowns
- Doesn't work on everything (ABNB struggled)
The low time-in-market is the real story here. You're making 7–12% CAGR while only deploying capital a fifth of the time. Stack this with another uncorrelated strategy or run it across multiple instruments and the numbers get more interesting.